More updates to Engine Watch, my Android app to list the quotas of your Google App Engine application!
This version adds a few things:
Here’s the barcode:
More updates to Engine Watch, my Android app to list the quotas of your Google App Engine application!
This version adds a few things:
Here’s the barcode:
I’ve published a small update to Engine Watch. This version fixes a crash when trying to show quotas for an app that isn’t deployed. It should now also be working on the HTC Tatoo and other small screen devices.
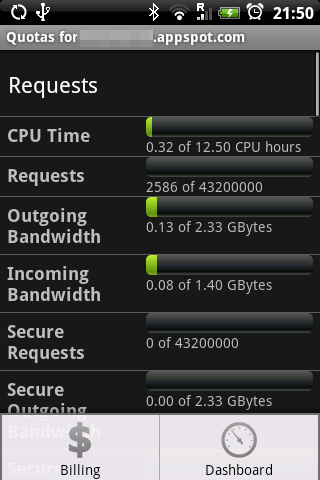
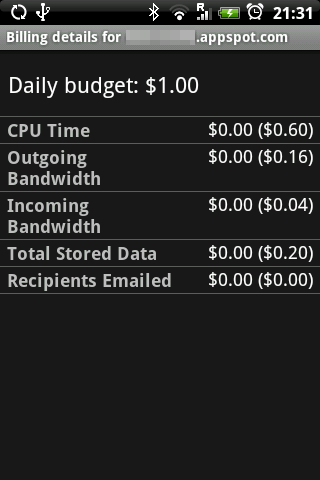
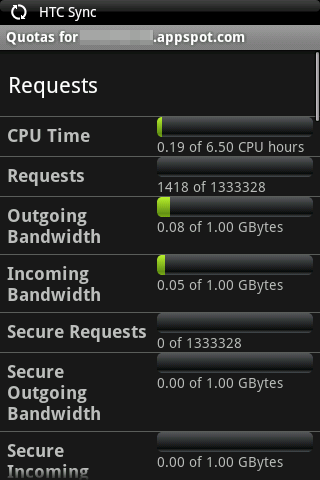
I’ve added a little feature to open the “normal” app engine console from the quota screen. Just use the menu and select “dashboard”. See this post for more info and the market barcode.I’ve just released my second free Android app, called Engine Watch. Engine Watch is a small utility that I wrote to monitor the quotas of my application on the Google App Engine cloud. Multiple accounts can be added and for each account you can select the application and get the current quota statistics, the same statistics you can see on the App Engine dashboard.
You can download engine watch by scanning this barcode:
or by searching for Engine Watch in the market. Let me know what you think!
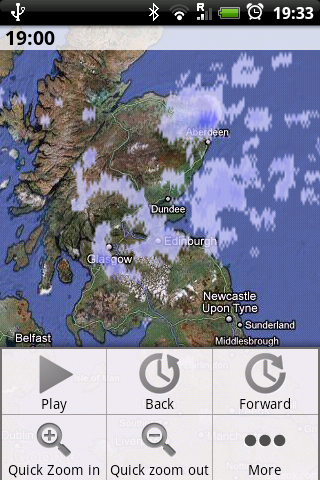
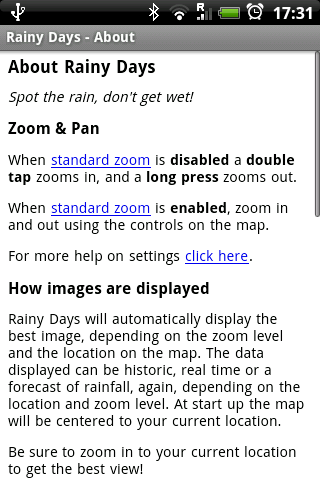
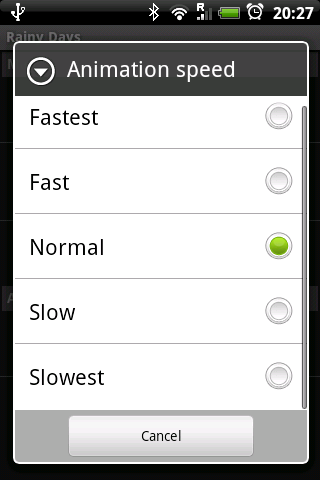
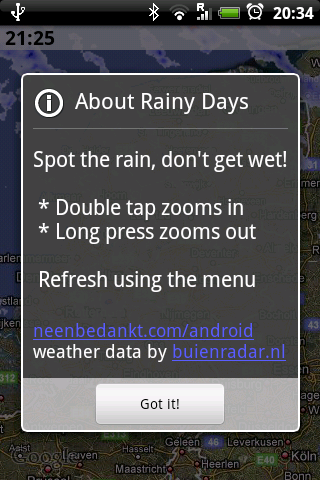
I’m happy to announce a new update to Rainy Days! This version adds new features, improvements, more coverage and bugfixes. One of the new features is the so called stop-and-go mode, where you can pause the animation by tapping the screen once.
Once paused you just swipe left to go back in the animation (earlier) or swipe right to go forward (later). You can also use the trackball or the menu to control the animation.
I also made a small demo video and as some people say: I’d love to show it to you :) I have fun with this new version!
Market barcode:Now that I’ve released my android app to the market it’s time to optimize :) I’d like my app to work on every device and I also would like every user to love it ofcourse. But this is not as easy as it seems…
For example, while the Android Market allows a user to comment on my app it doesn’t allow me to respond, moderate or even view all the comments from the market developer website. It is really hard to monitor the comments and ratings that users give my app, which is frustrating too as some users just use the one-star-does-not-work method when rating your app.
From within your app there are several options. One approach is to collect crash reports and send them to a server somewhere but to me this is a bit too much of a “while you are not watching” thing. One other approach is to use tools like log collector and kindly ask a user to take action.
But still the problem remains: how do you get a user to actually tell you that something is broken? If you are an android dev, how do you manage this? If you are a user, what would you like?
Let me know…
For Rainy Days I needed something to process the weather data that gets sent to the Android device, because some of the processing is simply to much for a mobile device. Since I had played around Google App Engine already I picked it as my PaaS of choice, besides I didn’t feel like mucking around with virtual servers on AWS anyway :)
Because I already had invested in some Java code that I also use on the client, and my python isn’t that fluent yet, I decided to run Java on appengine. My initial app was just a simple servlet, but I soon got fed up with all of the cruft related to that so I used Gaelyk as a lightweight framework. It allows me to code my “servlets” as groovlets, which are just plain groovy scripts, hook up my existing Java code and write new code either as Groovy or Java classes. It also adds some nice shortcuts for appengine, like accessing memcache like a normal map.
The things I like about app engine so far:
The biggest thing that I don’t like is: start up time for the Java vm. It simply takes too long, and has been blogged about here. Aparently it should get better when my app will get more load on it, but at the moment some requests take up almost 6 seconds just to serve up a “304 not modified” response. This startup time also adds to the total time allowed per request which isn’t helping. The precompilation option does seems to help however and aparently they are working on it at Google.
One other thing to consider is that you should deploy often. The development server doesn’t always emulate the real cloud perfectly and somethings will not work on the cloud while they work perfectly on your local environment and vice versa. This has bitten me a few times already.
All in all it has been a fairly positive experience so far. I might still take the plunge and rewrite my app in python if the start up time keeps being an issue, but I rather not :)
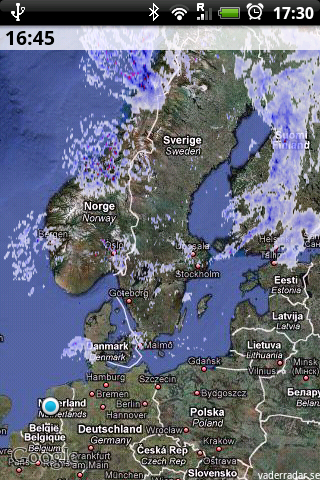
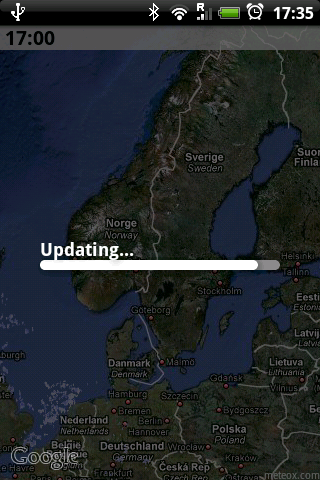
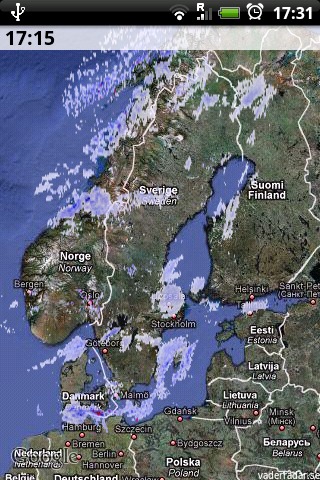
I’ve released another update for Rainy Days in the Android market, this time adding Scandinavia coverage, courtesy of vaderradar.se.
This new version also has other improvements and fixes, like new about screens and better management of the download cache. Also credits for the images are now displayed on the map in the bottom right corner.
Here’s a quick preview of the Scandinavian coverage in Rainy Days!
I’m getting some negative comments on the fact that there’s no rainfall image data available yet for a lot of places in the world. I hope you all understand that I’m doing this for free, in my spare time and that getting new image data is not as easy as it seems. There’s a lot of work into making the data show perfect on the maps, while dealing with the challenges of a resource limited device.
I understand however that some of you might be disappointed that Rainy Days is not (yet) working for your area, so I have now limited the availablity of my app to the countries that do have at least some coverage. As I add new coverage I’ll add more market locations. Please do comment on this, because I really like to hear from you. Thanks!Another release of Rainy Days has been published in the market! It took a little while longer than I anticipated, but I think it was worth the wait.
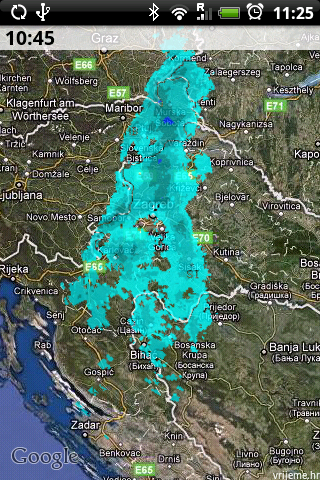
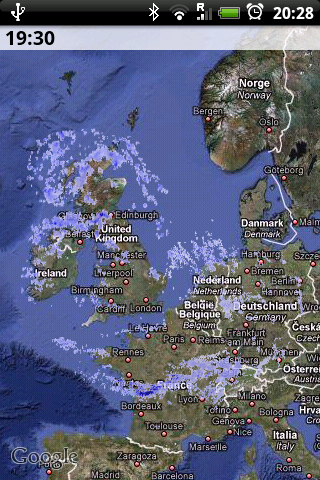
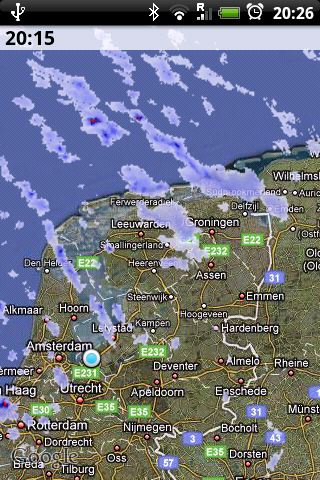
In this version I’ve added rainfall data for a large part of Europe. When you pan and zoom the map the best image for your location will be selected. If you zoom out you’ll get the Europe rainfall data, and when you zoom in to The Netherlands you’ll get the more detailed rainfall prediction. When there is no data available it will now be visible in the screen, and not the time display for some part of the world you don’t live in :) Other changes include:
But the biggest change are in the internals of the application. I’ll keep working on adding more coverage, I hope to report on that soon.
Check out the screenshots below and get the new version from the market using the barcode scanner, or by simply searching for Rainy Days. Enjoy!